By Kirsty Gasston
27th March 2014
Posted in Technology & Software News
It is important that you understand and review how people browse your site. Even the best website designs can fail as users don’t always browse and navigate through a site in the ways that we might expect. Focus groups with customers and members of your target market are an ideal way to gain great insights and feedback on how people navigate the site, how easily they locate the information that they’re seeking and any barriers to conversion. Although the data collected from focus groups is very indepth, it is often not feasible to gain feedback from a large sample, if at all, due to the time and costs associated with running a research project of this kind.
Google Analytics is a free tool that records data from all visits to your website – so your sample size for data collection is limited only by the amount of traffic coming to the site. The tool provides a good base of data and information regarding the search terms and keywords people are using to arrive at your website, where they have linked through from and some demographic information. The Visitor’s Flow function in Google Analytics can also give you some understanding about the path that users take through your site in terms of where they click. This data can, however, be quite difficult to analyse and it’s very difficult to visualise how users are interacting with the page.
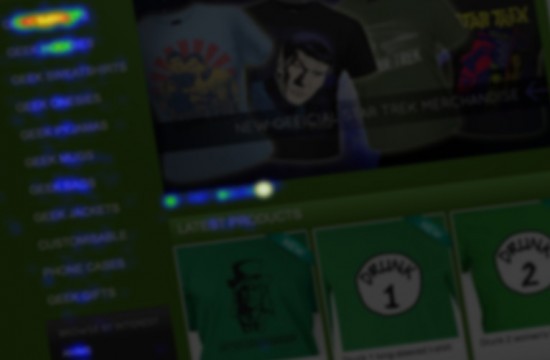 A great solution to provide you with richer data, without the high level of time and expense of focus groups is to use additional tracking code within your site that provides the data to generate heat maps, scroll maps, click overlays and confetti maps. These reports use a snapshot image of the page that is being analysed, and data is overlaid to visually map where website visitors have clicked, the areas of the page to which they have scrolled, and a separation of data on a variety of factors (such as source, new vs returning visitors, device type, search terms and more) to compare how these varying users interact with the page. For example, in data analysis of this kind, you may identify that visitors that have arrived to the page from Facebook or another social media channel interact with the page and click in different areas than those users that have arrived via a search engine. This type of click analysis data can be highly valuable in informing your social media marketing campaigns. Likewise, identifying the areas of the page that are most commonly viewed and clicked can aid you in planning of layout and design changes for the page, for example the placement of important information, advertisements or buttons.
If you’re looking to collect more data regarding how users browse and interact with key pages of your website, speak to the Rapid Web Services team today on 01785 250 222.